
Jun 26, 2026Market Insights
Macroeconomic Pulse (I): Consumer Spending and Retail Activity Across Major Economies
Several of the world’s largest economies reported positive performance between late 2025 and early 2026, with household consumption, retail sales, and service activity all showing steady growth.
Household income and consumption trends continue to play a central role in sustaining global economic activity. Several of the world’s largest economies reported positive performance between late 2025 and early 2026, with household consumption, retail sales, and service activity all showing steady growth.
While expanding demand provides a supportive environment for businesses, geopolitical tensions—particularly those linked to the ongoing conflict in the Middle East—pose risks that could disrupt this momentum.
This analysis reviews key activity indicators across the United States, the United Kingdom, the European Union, and China.
Retail Activity
United Kingdom
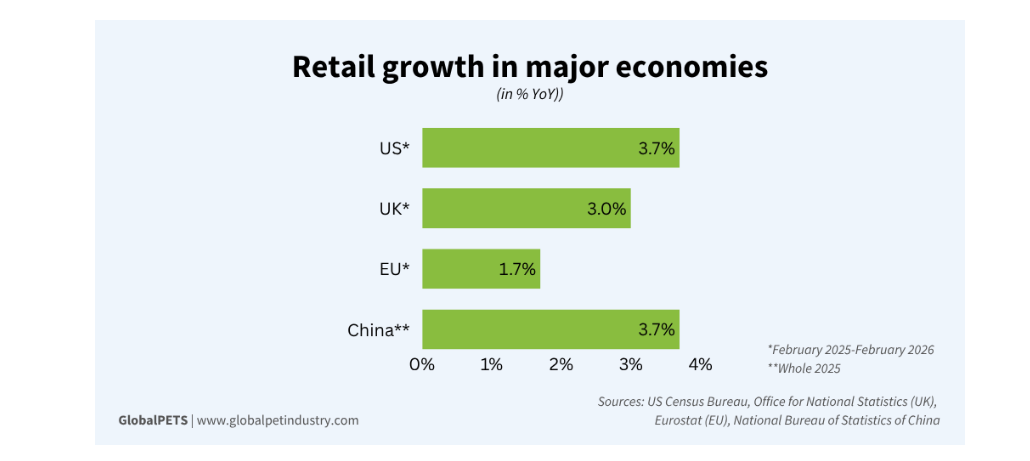
Retail sales in Great Britain increased 0.7% in the three months to February 2026 compared with the three months to November 2025, according to the Office for National Statistics (ONS). Sales volumes were 3% higher than a year earlier, marking the strongest quarter since February 2023.
Growth was driven primarily by non‑store retailers—mainly online sellers, along with street stalls and markets—which recorded a 2.7% increase during the quarter, peaking in January. Food and household goods stores saw slight improvements, while department stores, textiles, and footwear experienced declines.
United States
The U.S. also posted positive results. Retail and food service sales rose 3.7% YoY in February, reaching $738.4 billion (€630B), according to the U.S. Census Bureau.
Nonstore retailers again led growth, with revenue up 7.5% YoY. Miscellaneous store retailers—including pet and pet supply stores—recorded the strongest performance, rising 11.6% YoY.
European Union
The EU and eurozone both recorded 1.7% YoY retail growth in February. Although sales volumes dipped slightly from the peak at the end of 2025, the overall index has trended upward since 2021.
Eurostat’s three main segments all expanded:
- Food, beverages, tobacco: +0.9%
- Non‑food products: +2.3%
- Fuel for vehicles: +1.6%
China
China matched the U.S. with 3.7% YoY growth, reaching ¥50.1 trillion ($7.3T/€6.3T) in retail sales of consumer goods in 2025. According to the National Bureau of Statistics, both basic living goods and upgraded consumer categories showed strong momentum.
Household Spending
United States
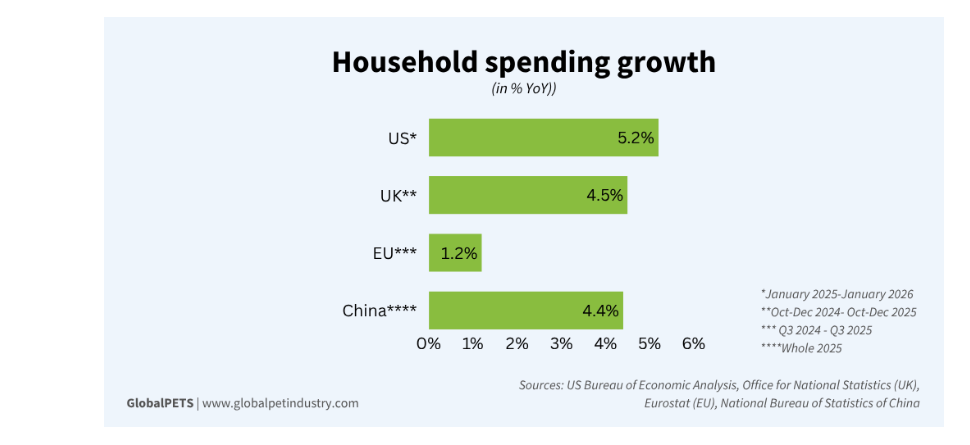
Personal consumption expenditures rose 0.4% in January, supported by a 0.4% increase in personal income, according to the U.S. Bureau of Economic Analysis. Monthly expenses reached $21.5 trillion (€18.4T), a 5.2% annual increase.
Higher private‑sector salaries and expanded social security benefits strengthened household income. Spending growth was led by:
- Healthcare
- Housing and utilities
- Financial services and insurance
Goods spending increased in categories such as food and beverages, recreational goods and vehicles, and durable household equipment.
United Kingdom
The UK publishes consumer trends quarterly. From October to December 2025, household spending grew 0.4% YoY. For the full year, spending rose 4.5% YoY at current prices, reaching nearly £1.8 trillion ($2.4T/€2T). Seasonally adjusted growth was 0.8%.
Britons spent 2.1% more on recreational items, equipment, gardens, and pets—totaling £51.2 billion ($68.7B/€79B). However, spending on pets and related products fell 0.7% to £11.9 billion ($16B/€13.7B), and veterinary and other pet services declined 2.7% to £6.5 billion ($8.7B/€7.5B).
European Union
In Q3 2025, household consumption per capita increased 1.2% YoY, matching the 1.2% rise in household income per capita. Growth was supported by higher salaries and social transfers. Both indicators have trended upward since 2017, aside from pandemic‑related declines.
China
China’s per capita consumption expenditure rose 4.4% YoY in 2025, with rural areas outpacing urban regions. Growth was strongest in:
- Miscellaneous goods and services: +11.2%
- Education, culture, recreation: +9.4%
- Transportation and telecommunication: +8.3%
- Household facilities: +7.7%
Nationwide per capita disposable income increased 5% YoY.
Opportunities Tempered by Global Instability
Looking ahead, the continuation of this growth cycle will depend on the balance between solid economic fundamentals and external shocks. Rising incomes and evolving consumption patterns—especially the shift toward services and digital retail—create a favorable environment for businesses across sectors, including pet care.
However, geopolitical instability remains a significant risk. Companies will need agility not only to capture current demand but also to navigate potential volatility in the months ahead.
Part two of this story, covering interest rates and inflation, is coming soon. Stay tuned.
Source:GlobalPETS